

Prior to Kyverno v1.4.0, you may have noticed that Kyverno does not expose any metrics to monitor its status as well as the policy execution information. Although you could view the policy reports with kubectl command, Kyverno lacked the ability to observe the metrics associated with different targets. Now, with the new Prometheus based metrics enabled, Kyverno provides observability at various levels for cluster administrators, end users and DevOps. Exposing Prometheus metrics is an extremely important requirement for running Kyverno in production environments.
Prometheus Metrics
Kyverno exposes five metrics at various levels. These metrics track the policy changes, the rule execution status, the admission review latency, etc.
Metric – Policies and Rule Counts
This metric records all the policies and rules that are currently available in the cluster, it also keeps a record of policies’ history, i.e., the policies that were created before and removed after. The metric provides additional observability for policy types that cannot be shown by “kubectl”. It also gives the cluster admin an overview of the policy information.
Metric – Policy and Rule Execution
This metric tracks the rule execution results of the admission requests as well as the background scan process. For cluster admin, it can be used to monitor the overall security compliance of the namespaces, applications at the given interval. Cluster users could use this metric to enforce best practices for their applications. Overall, this metric can be used to secure the cluster configurations.
Metric – Policy Rule Execution Latency
This metric tracks the execution latency at the rule level. Since each rule only matches the similar kinds of resources, for example Deployment, StatefulSet etc., this metric can be leveraged to further tune policies. Either adding a namespace selector or configuring the annotation filters can help reduce unnecessary processing.
Metric – Admission Review Latency
This metric records the overall latency of the admission review process. It measures how much delay Kyverno policy adds to each incoming admission request. It’s important for the cluster admins and users to have the ability to observe the latency of the deployment process.
Metric – Policy Change Counts
This metric can be used to track the history of all the policy changes such as policy creations, updates and deletions.
Viewing metrics with a Grafana Dashboard
Before You Begin
To make this tutorial easier and more focused, we’ll use Minikube to install Prometheus and Grafana for scraping the metrics of the Kyverno controller. Since the Minikube spawns a local single-node Kubernetes virtual machine, we’ll install Kyverno with the Service type NodePort in order to access these services directly.
To install Kyverno add the helm repo and install the chart with Service type NodePort with a fixed port number:
helm repo add kyverno https://kyverno.github.io/kyverno/helm install kyverno kyverno/kyverno
--namespace kyverno
--create-namespace
--set=metricsService.type=NodePort
--set=metricsService.nodePort=30539
Verify that Kyverno is running:
$  kubectl -n kyverno get service
NAME                  TYPE        CLUSTER-IP      EXTERNAL-IP   PORT(S)          AGE
kyverno-svc           ClusterIP   10.111.10.251   <none>        443/TCP          1m
kyverno-svc-metrics   NodePort    10.96.130.185   <none>        8000:30539/TCP   1m

$ kubectl -n kyverno get pod
NAME                                 READY   STATUS    RESTARTS   AGE
kyverno-6d759cfdbd-p5qvb             1/1     Running   0          2m
Note that the kustomize bases used in this tutorial are stored in the examples folder of the GitHub repository kyverno/grafana-dashboard.
Deploy and Configure Prometheus Dashboard
The Prometheus server must be configured in order to scrape Kyverno metrics.
To deploy Prometheus in Kubernetes:
kubectl apply -k github.com/kyverno/grafana-dashboard/examples/prometheusPrometheus Dashboard
Get the IP of the Minikube:
$ minikube ip
192.168.64.19
If the cluster is running on the host, this IP would be the hostIP.
Obtain the node port of the Prometheus service:
 $ kubectl get -n kyverno service
NAME                  TYPE        CLUSTER-IP       EXTERNAL-IP   PORT(S)          AGE
kyverno-svc           ClusterIP   10.100.152.34    <none>        443/TCP          8m49s
kyverno-svc-metrics   NodePort    10.101.28.174    <none>        8000:30539/TCP   8m49s
prometheus-server     NodePort    10.110.250.122   <none>        9090:30886/TCP   6m12s
Open your browser and visit the following URL: http://{IP_address}:{prometheus node port} to load the Prometheus Dashboard.
According to the above configuration, the URL will be http://192.168.64.19:30886.

Grafana Dashboard
Deploy Grafana with the following command:
$ kubectl apply –k github.com/kyverno/grafana-dashboard/examples/grafana

$ kubectl get -n kyverno service
NAME                  TYPE        CLUSTER-IP       EXTERNAL-IP   PORT(S)          AGE
grafana               NodePort    10.107.143.226   <none>        3000:31873/TCP   28s
kyverno-svc           ClusterIP   10.100.152.34    <none>        443/TCP          15m
kyverno-svc-metrics   NodePort    10.101.28.174    <none>        8000:30539/TCP   15m
prometheus-server     NodePort    10.110.250.122   <none>        9090:30886/TCP   12m
Log into the Grafana dashboard with the URL http://192.168.64.19:31873. Again, if the cluster is running on the host, the URL will be http://{IP_address}:{grafana node port}. The username and password is “admin”.
Once logged in, you will need to add data source to Grafana, go to Configuration -> Data Sources:

Click on Add Data sources and select Prometheus, and then configure HTTP URL using the Prometheus service http://prometheus-server.kyverno.svc.cluster.local:9090
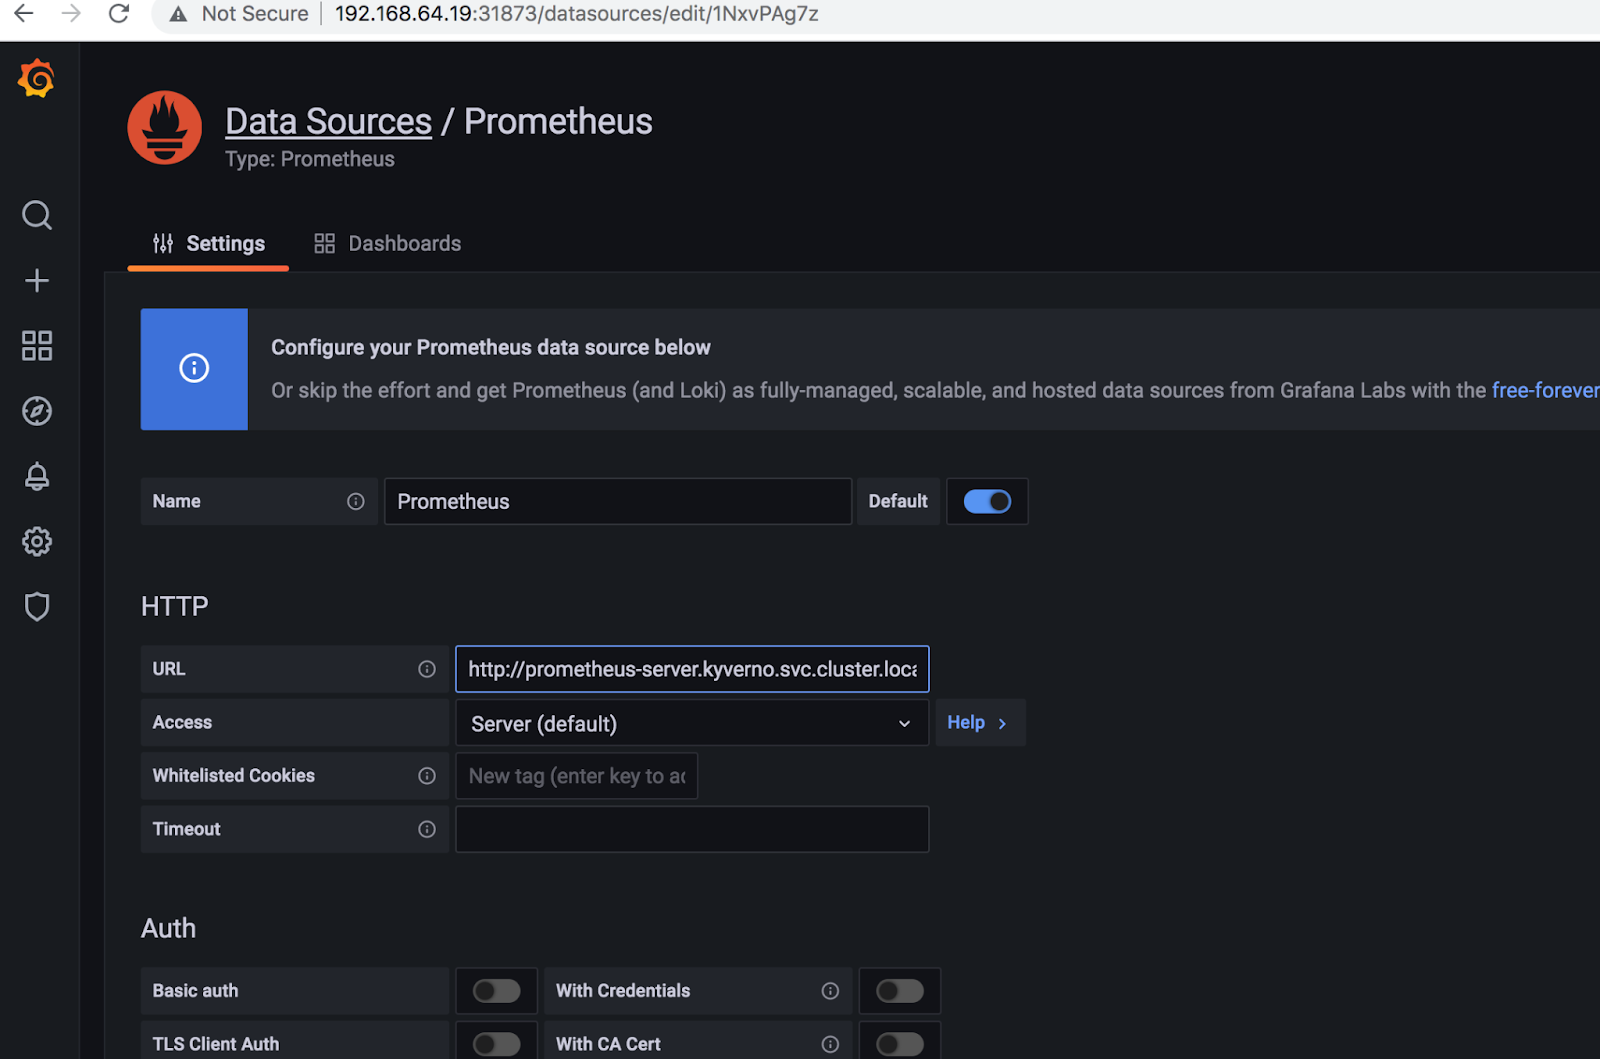
Scroll down to the bottom and click on Save & test to verify the connection.
Once it’s saved, import the kyverno-dashboard.json to Grafana, and select Prometheus as the data source:
$ curl https://raw.githubusercontent.com/kyverno/grafana-dashboard/master/grafana/dashboard.json -o kyverno-dashboard.json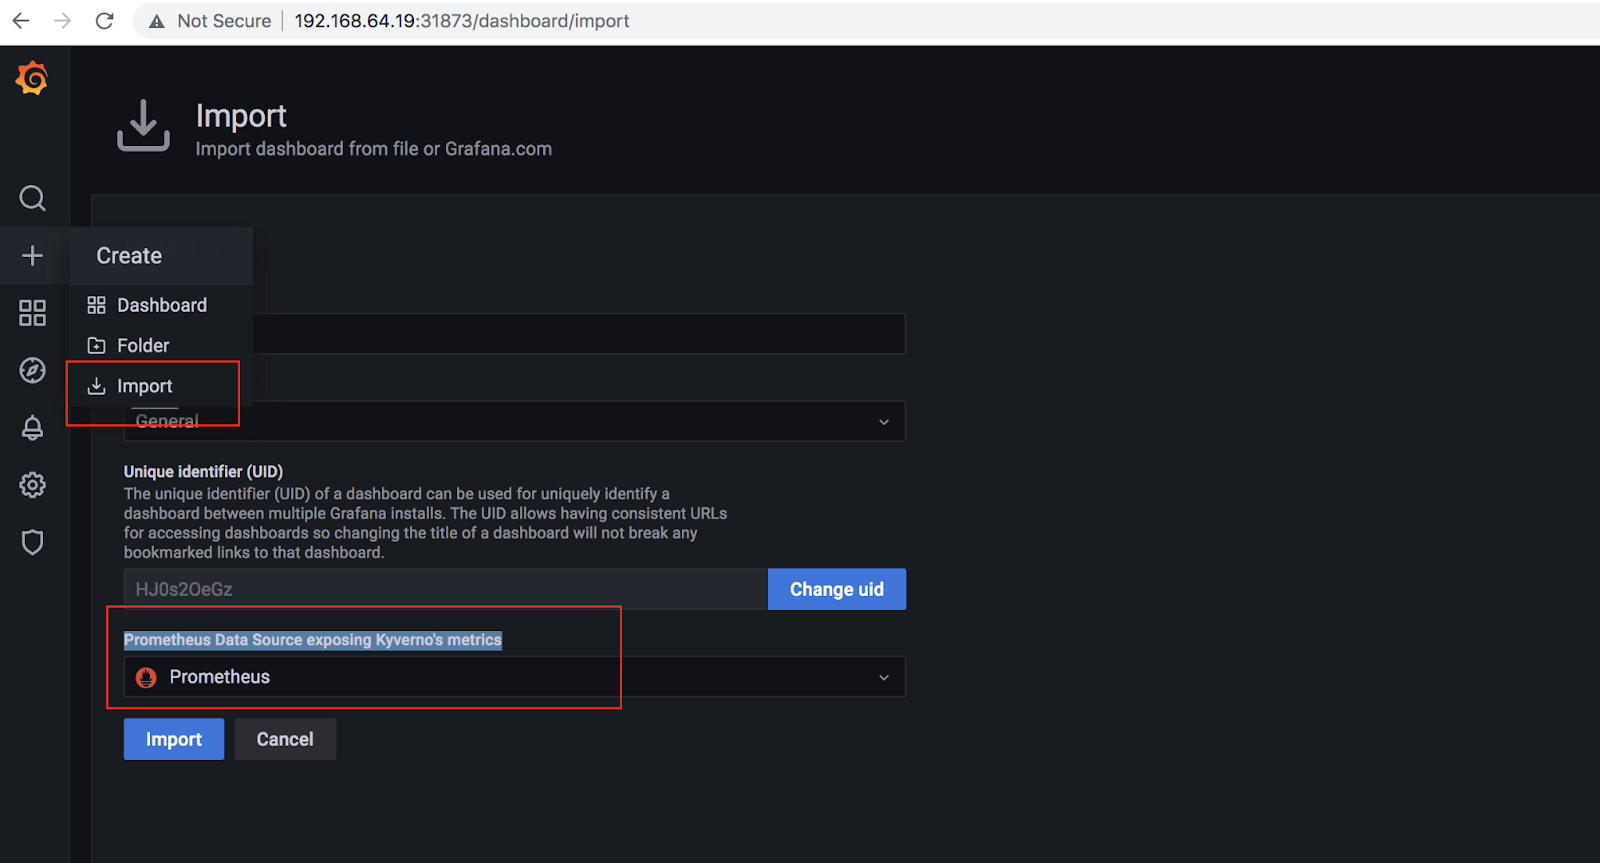
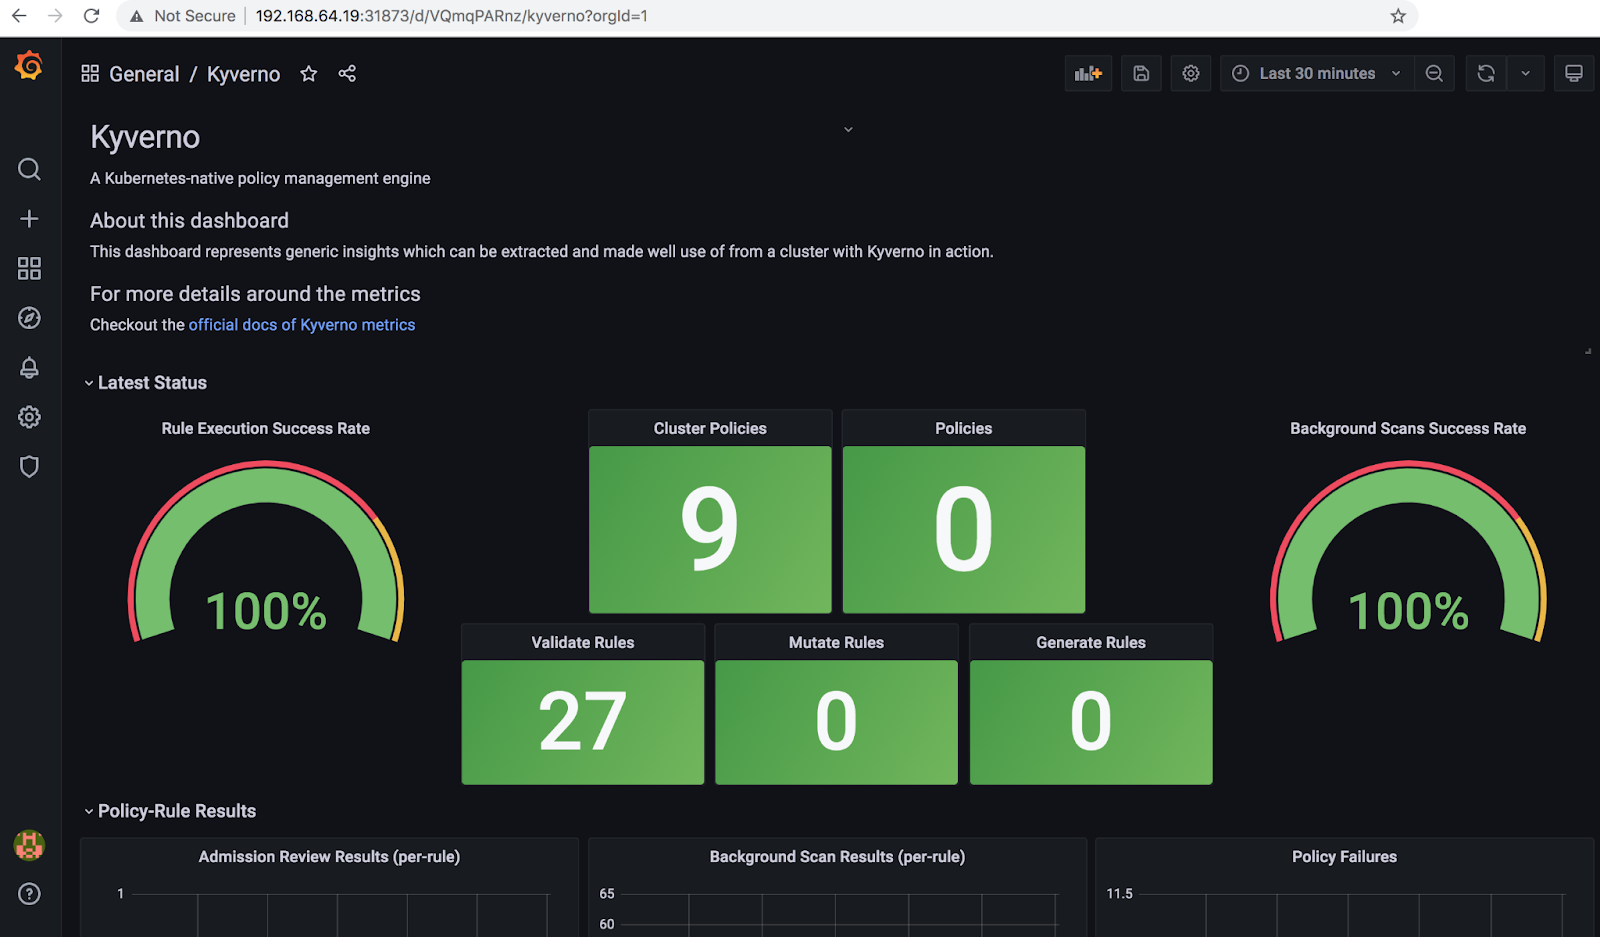
Click on Import, you will get a Kyverno dashboard ready!
Conclusion
The post provides a high level overview of observability in Kyverno. For more detailed information and usage, please refer to the official documentation. If you are looking for a production-ready addon to secure cluster configurations, please try out 1.4.0 and let us know how it works! You can reach out to the Kyverno team on the #kyverno Slack channel or mailing list.
If you are already using Kyverno and looking to simplify policy management across your clusters, please check-out the Nirmata Policy Manager for Kyverno. You can register for early access here, below. If you have general questions on Nirmata or Kubernetes, please use our form to get started. See our Resources for deeper information on Kubernetes and containerization as a service.

Sorry, the comment form is closed at this time.