


Nirmata’s Cloud Agents Audited a 40-Cluster Kubernetes Fleet, and recovered 40% of the Cost
Most Kubernetes Cost overruns don’t come from one singularly bad decision. They come from dozens of reasonable ones — made independently, by different teams, at different times — that are hard to correlate, reconcile and then manage on an ongoing basis.
Nirmata’s Control Hub offers customizable agents, designed for secure and scalable fleet-wide automation. Service Agents run in your cluster, while managed Cloud Agents run in Control Hub and can be invoked with flexible triggers.
We recently ran Nirmata’s Cost Analyzer and Resource Optimizer Cloud Agents across an enterprise customer’s full production fleet: 40 clusters, built up over years by multiple teams.
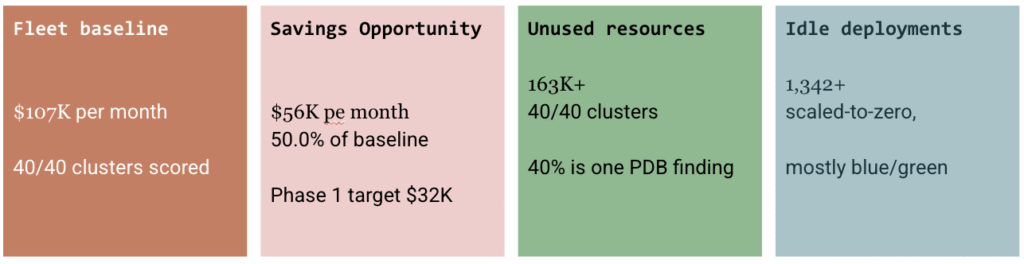
The agents scored every cluster for both cost and resource cleanup — no sampling, no “representative subset.” What came back: a ~$107K/month compute baseline with roughly 50% recoverable through right-sizing alone, before deleting a single stale object.
Here’s what the fleet-wide view surfaced, and why “audit once a quarter” isn’t the same thing as governance.
🔍 What we ran
Two cloud agents, applied uniformly across every cluster:
- Cost Analyzer — Right-sizes against live prometheus and/or metrics-server data, producing baseline cost, savings opportunity, and a per-namespace breakdown.
- Resource Hygiene — Scans for unused Services, ConfigMaps, PVCs/PVs, idle Deployments, stale ReplicaSets, empty namespaces, and orphan or crash-looping pods.
40 of 40 clusters were scored for both. That completeness turned out to matter — the single largest finding in the whole engagement came from a cluster whose scan had quietly fallen out of the regular report cycle and only surfaced on a verification pass.
🧩 Five habits explain most of the waste
Once we looked at all 40 clusters together, the waste stopped looking like 40 unrelated problems and started looking like five repeating habits:
- Over-Provisioning: While there were quite a few One CI namespace, duplicated across two clusters, drove $32K/month alone — five namespace-instances made up 55% of all fleet savings.
- Blue/Green Idle-Deployment Sprawl: 1,800+ deployments sit scaled-to-zero fleet-wide; some are marked “DO NOT DELETE” standby, not waste.
- Stale ReplicaSet Accumulation: No revisionHistoryLimit anywhere in the fleet — 40,000+ stale objects bloating etcd fleet-wide.
- Governance Gaps Masking Spend: Six clusters show $0 savings only because BestEffort QoS or missing metrics-server leave nothing to compare against.
- Orphaned Storage: 4.7+ TiB of PVCs/PVs outlived the workloads that created them, mostly databases and CI caches. This amounted to about $800 in cost every month.
🚨 The finding too big for the pattern list
One cluster’s hygiene scan turned up 70,000+ unused PodDisruptionBudgets — a single number that accounted for nearly 40% of all unused resources across the entire fleet, combined.
That volume isn’t just clutter. At that scale, PDB evaluation adds real overhead to every node drain, rolling update, and autoscaler decision on that cluster — every disruption-triggering operation has to check compliance against every matching budget. The likely cause: a CI pipeline creating a PDB per build job for eviction protection, with no corresponding cleanup step. Nobody had noticed, because nothing was watching for it — there wasn’t even an existing policy to mark unused PDBs, let alone clean them up. That gap got scheduled as new work, not swept under an existing policy that didn’t fit.
⚠️ Stability and security issues that had nothing to do with cost
Independent of any dollar figure, the same scans surfaced 35 pods actively crash-looping across 15 clusters, and 100+ orphaned debug/build pods with no owner references — leftover kubectl exec-style debug containers, stuck CI jobs, and at least one personal dev pod sitting in a default namespace. None of that shows up in a cost dashboard. All of it is a live risk.
📅 A four-week plan, not a big-bang cutover
Snapshot-derived savings numbers are a ceiling, not a target — cutting straight to the full recoverable amount risks throttling workloads that need burst headroom the snapshot didn’t capture. The remediation plan targeted 50% capture in Phase 1, sequenced as:
- Week 1 — Stabilize (fix crash-looping pods, triage orphans), deploy mark-only policies fleet-wide, and scope the PDB anomaly before touching it.
- Week 2 — Right-size the top five namespace-instances in staging first, with human review on every change.
- Week 3 — Bulk-execute the safe, well-understood cleanup categories (stale ReplicaSets, confirmed-empty namespaces) — deliberately excluding the PDB finding until its policy and root cause exist.
- Week 4 — Second-wave right-sizing on the long tail, plus the guardrails (revisionHistoryLimit, HPA, metrics-server) that keep the waste from coming back.
🤖 Detection Is Only Half The Fix
Writing the fix is still work, though. Fixing issues in a cluster in a team sport, involving platform teams, SRE teams, and developers. This entire process is laden with friction and a big reason why most of the Kubernetes clusters out there are over provisioned. Nirmata’s Remediator Agent automates that handoff: it reads the violation, drafts a fix with an AI model, and opens a pull request — a human still reviews and merges it. Platform teams get continuous scanning without adding headcount per cluster; developers get an explained, ready-to-review PR instead of a raw alert. And this can be performed in live clusters as well as further ahead in pipelines based on use cases.
🛡️Now, how can I continuously optimize clusters ?
There were two big issues that needed to be addressed –
- Ensuring that applications are right sized on an ongoing basis.
- Automate removal of crud collected on a regular basis.
For the first issue, Nirmata team used its Kyverno based solution to automatically detect and inform the developers of the optimized configuration. Combined with Nirmata’s policy based detection and alerting along with remediation, agents automatically created PRs for the developers with the right resources. All they had to do was review and approve the PR, and applications were optimized.
Clusters catching crud and drift from the planned and designed clusters is just natural over a period of time and the key is to have an active real-time approach to managing it so it does not create availability, performance or cost issues over time. Kyverno’s ability to identify such resources and then delete them based on risk tier ensured that these issues never got out of hand. Here are some sample policies that detected and combined with deleting policies, ensured pristine cluster hygiene.
Every cleanup category mapped to an existing policy-as-code pair (Kyverno mark/validate) — except PodDisruptionBudgets, which needed a new one written from scratch. But the more important pattern was procedural, not technical: every single report closed with the same line — cleanup requires human review and stakeholder sign-off. Nothing gets deleted automatically. The blue/green “DO NOT DELETE” flag above is exactly why: a resource that looks identical to waste in raw telemetry can be load-bearing in a way only a human on the owning team would know.
| Finding | Mark policy | Risk tier |
| Stale ReplicaSets | mark-stale-replicasets-policy.yaml | Safe |
| Empty namespaces | mark-empty-namespaces-policy.yaml | Safe |
| Unused PVs | mark-unused-pvs-policy.yaml | Safe |
| Unused services | mark-unused-services-policy.yaml | Review |
| Unused ConfigMaps | mark-unused-configmaps-policy.yaml | Review |
| Unused PVCs | mark-unused-pvcs-policy.yaml | Caution |
| Idle deployments | mark-idle-deployments-policy.yaml | Caution |
| Orphan / CrashLoop pods | mark-orphan-pods-policy.yaml | Investigate |
| Unused PodDisruptionBudgets | — none exists yet — | No policy |
💡 Why this matters beyond one fleet
The interesting part isn’t the dollar figure — it’s that none of these five habits were exotic. They’re the default outcome of normal Kubernetes operation at scale: teams set generous limits once and never revisit them, blue/green leaves standby capacity behind, nobody sets revisionHistoryLimit, and a policy suite that covered eight resource types missed a ninth until an agent went looking. A quarterly manual audit would have caught some of this. It would not have caught a 3-day-old scan gap on one cluster hiding the single largest finding in the report, and it would not have caught it before the next quarter’s bill.
That’s the case for running cost and hygiene as continuously operating cloud agents rather than a point-in-time audit: the fleet doesn’t stay still long enough for a quarterly snapshot to stay true.
A few questions worth asking about your own fleet:
- How are you optimizing the clusters today? What does your Kubernetes optimization blueprint look like?
- Is your Cost Management solution just provides visibility or actually provides a plan and automation to achieve savings?
- How are issues that span multiple teams resolved today? Is it one big call bridge?
- What is the plan to prevent such issues from occurring?
If you’re curious what a fleet-wide Cost Analyzer + Resource Optimizer pass would surface in your own environment, reach out — hello@nirmata.com.
— The Nirmata Team

